State of California Developmental Disabilities System Employment Data Dashboard


INTRODUCTION

Welcome to California’s Data Dashboard for employment of people with developmental disabilities. People with developmental disabilities seek to work, earn and be part of the economic life of their communities. On October 9, 2013, Governor Brown signed AB 1041 (Chesbro) into law, establishing an Employment First Policy in the Lanterman Developmental Disabilities Services Act. This dashboard presents up-to-date data on how well California is doing in implementing the new policy and supporting people to have regular jobs at regular pay.

Wage Gap- Average Hourly Wage Where People Are Served. Data from DDS Purchase of Services Employment Rate - Disability vs without Disability
Number of DDS Consumers Earning Wages between 2019 and 2021. 2019: 31919 2020: 29757 2021: 27699 Infographic comparing people employed with developmental disabilities versus those with out a disability

In 2011, California used the National Core Indicators Survey to ask about 8,400 regional center clients if they worked, and, if they did, how much they earned.  On average people working in regular integrated jobs made $9.89/hour, while people working in groups of regional center clients made $6.24/hour.  Thus, people in regular jobs make on average $3.65/hour more than people with developmental disabilities working in groups.  This is 58% more per hour.

Click here for more information


In FY 2021/22, only 7.7% of regional center clients were served in Individual Placement Supported Employment in regular jobs with regular pay. 3.3% were served in work activity programs (sheltered workshops), and 84% were served in day or “look alike” day programs, largely in non-work settings.

Click here for more information

According to the US Census Bureau, in 2014, 74.7% of the California working age population worked full-time. This compares with Employment Development Department (EDD) data of 13.1% for working age regional center clients who received wages, most of them working part-time and many earning sub-minimum wage.
Click here for more information
     
How Many Receive Wages - Average Number of Consumers Average Monthly Earnings - Reportable Wages Education - Completing High School
Average Monthly Earnings from 2019 to 2021. 2019: $731 2020: $736 2021: $984 Academic Year 2017-2018. 2,872 graduated. 1,547 completed. 3,347 incomplete. Data from CA Department of Education

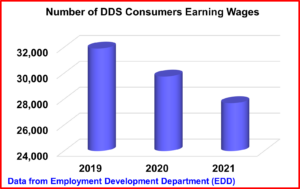
in 2019, EDD reports that 31,919 regional center clients received wages. However, those numbers have dropped significantly over the course of 2020-2021, with only 26,699 regional center clients earning wages in 2021.

Click here for more information

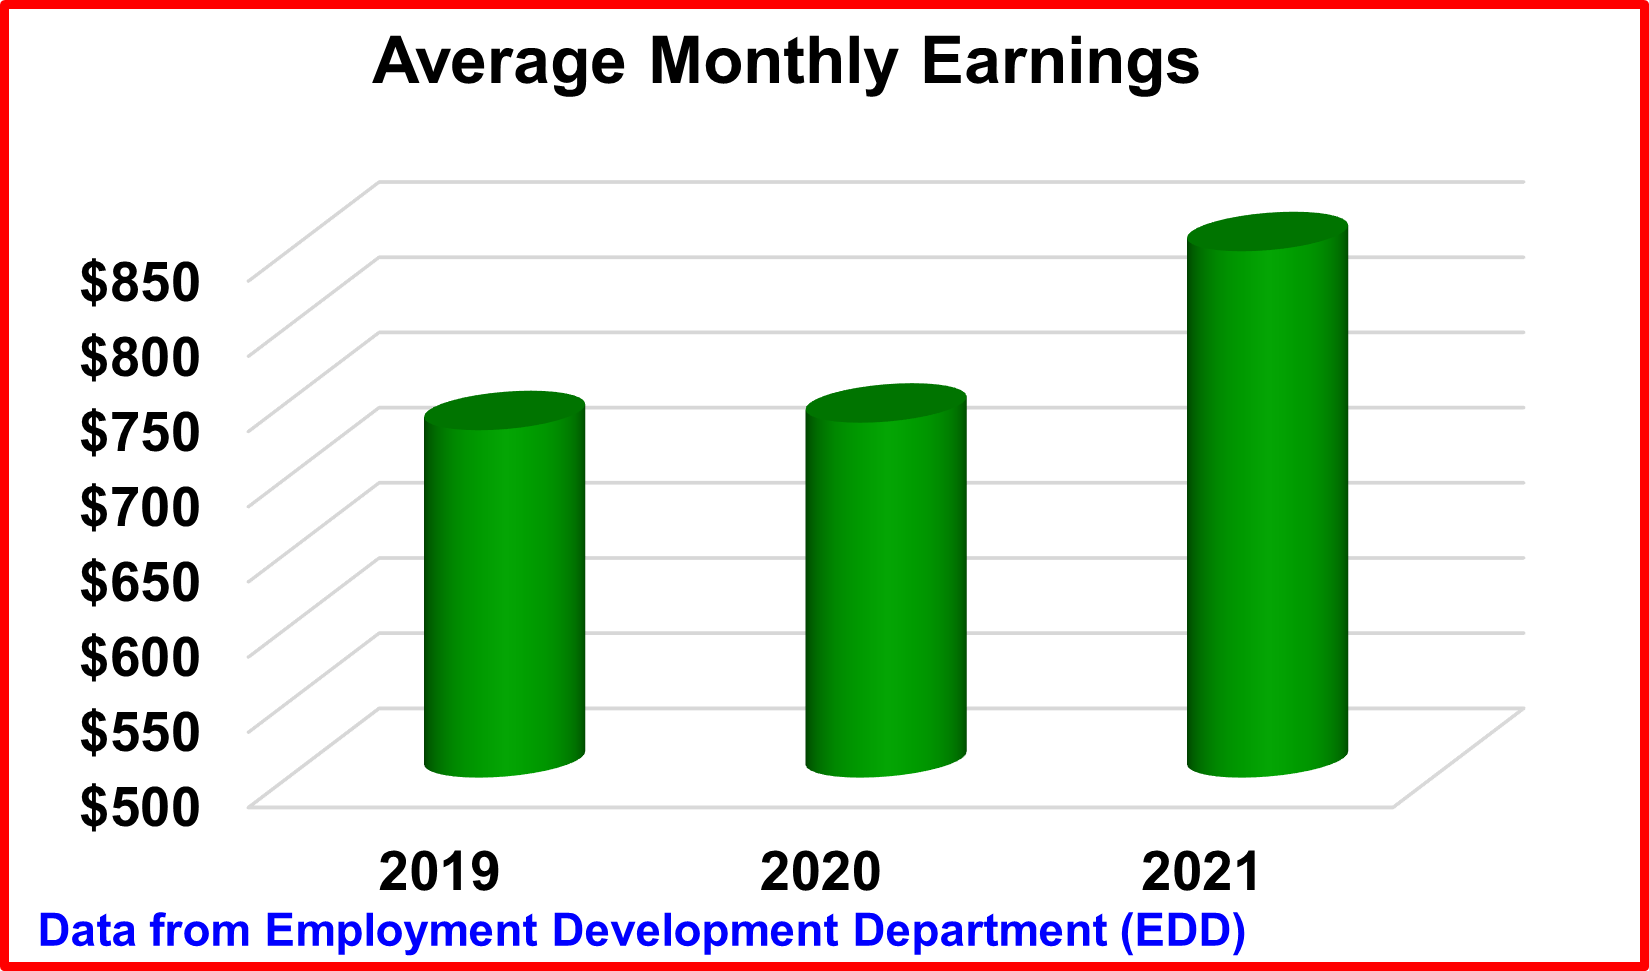
According to data from the EDD, the average monthly earnings for regional center clients only increased by $4 between 2019-2020 but increased to $984 in 2021.

Click here for more information

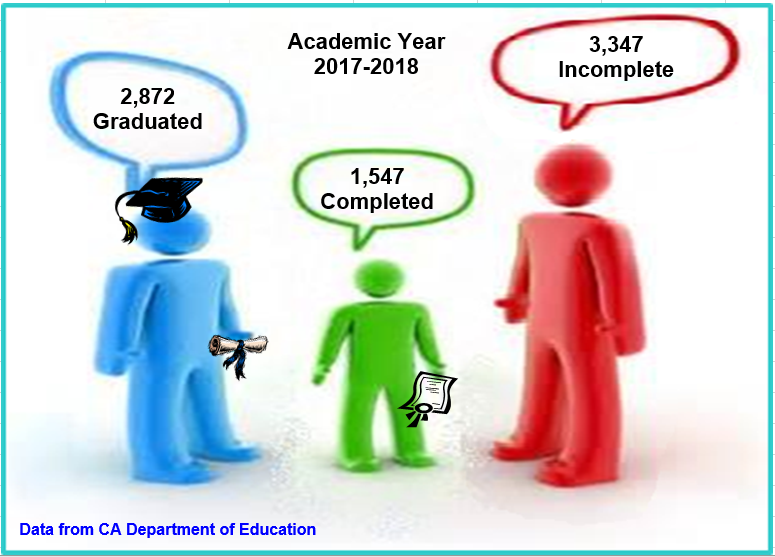
For June 2018, the California Department of Education reports that 7,624 students with significant disabilities (autism, intellectual disabilities and traumatic brain injury) left K-12 education.  Of those, 35.3% graduated, 22.8% received a certificate of completion, and 41.8% either dropped out or aged out.

Click here for more information